

product Details
Explore More
Alternatives

About Chart Echo
Chart Echo is a powerful pattern recognition tool designed for traders and investors who want to base their decisions on historical precedent rather than guesswork. The product automatically searches approximately 450 million historical windows across stocks and cryptocurrencies to find chart patterns that closely resemble the setup you are currently watching. Once it identifies these historical matches, Chart Echo overlays them on your current chart in gold and provides detailed outcome statistics showing how each match performed in the days and weeks following the pattern. This allows users to study real market history before making a trade or investment decision. The tool is built for active traders, long-term investors, and crypto watchers alike, offering a guided five-step workflow that takes you from selecting a market to acting on the analysis. Chart Echo is not a prediction engine or financial advice provider; it is a data-driven research tool that organizes the market’s own memory so you can study precedent in seconds. The platform is free to start with no account required, and paid accounts unlock additional features like saved workspaces, premium mode, intraday timeframes, alerts, and watermark-free exports. Chart Echo is available as both a web application and a mobile app, making it accessible for checking setups away from the desk.
Features
Massive Historical Database
Chart Echo searches through approximately 450 million historical windows across stocks and cryptocurrencies to find patterns that match your current chart. This extensive database covers decades of market data, ensuring that you get a statistically meaningful sample of historical analogs. The system ranks these matches by similarity strength and provides detailed outcome statistics including average move, typical drawdown, and the probability of rising, falling, or going nowhere. This feature transforms decades of market history into an instantly searchable resource.
Guided Five-Step Workflow
The application walks users through a clear, structured path from start to finish. Step one involves picking the stock or crypto you are watching. Step two lets you set the timeframe and define how many candles constitute the pattern. Step three displays a ranked list of historical echoes with similarity scores. Step four allows you to overlay a selected match in gold against your live pattern and read outcome statistics. Step five offers actions like saving the workspace, setting reminders, watching for new fractals, or sharing a Story GIF. This guided approach eliminates guesswork and blank canvas confusion.
Historical Pattern Overlay
Once Chart Echo finds matching historical patterns, it overlays those past matches directly onto your current chart in a distinctive gold color. This visual overlay allows you to see exactly how the historical pattern aligned with your current setup, making it easy to compare shapes and structures. You can cycle through multiple matches and see each one superimposed on your chart, along with the subsequent price action that followed. This feature provides an intuitive, visual way to study precedent without needing to scroll through decades of charts manually.
Outcome Statistics and Analytics
For each historical match and for the aggregated set of matches, Chart Echo computes and displays detailed outcome statistics. You can see how often setups like yours rose, fell, or went nowhere, the average percentage move over a specified forward period, and the typical drawdown experienced along the way. These statistics are presented in clear, easy-to-understand formats that help you assess the probabilistic range of outcomes. The analytics are grounded in actual historical data, not subjective opinions or indicators.
Use Cases
Pre-Trade Pattern Validation for Active Traders
Active traders can use Chart Echo to validate a potential trade setup before committing capital. Before taking a position, a trader can input their current chart pattern and instantly see the closest historical analogs. They can review how those analogs resolved over the following days and weeks, including the average move, typical drawdown, and probability of success. This data-driven validation helps traders avoid setups that historically performed poorly and gives them confidence in patterns with strong historical precedent.
Long-Term Investment Sanity Check
Long-term investors can use Chart Echo to sanity-check major market events like breakouts or sell-offs against decades of historical precedent. Instead of relying on a single analyst’s opinion or media narrative, an investor can see how similar chart patterns played out in the past. For example, if a stock breaks out to new highs, the investor can search for historical breakout patterns and see the typical continuation or reversal behavior. This provides an objective, data-grounded framework for making long-term decisions.
Cryptocurrency Pattern Analysis
Crypto traders and investors can leverage Chart Echo to analyze the notoriously repetitive patterns in cryptocurrency markets. The tool supports major cryptocurrencies like Bitcoin and Ethereum, allowing users to match current crypto chart structures against their own past patterns and across other assets. Given that crypto markets often exhibit strong fractal behavior, this feature helps users identify when a current setup has happened before and how it resolved. This is particularly valuable for spotting potential blow-off tops or capitulation lows.
Educational Study of Market Rhymes
Students of technical analysis and market behavior can use Chart Echo as an educational tool to study how markets repeat themselves. By searching for patterns on any stock or crypto, users can build an intuitive understanding of how certain chart formations tend to behave over time. The ability to overlay historical matches and review outcome statistics provides a hands-on learning experience that goes beyond textbook pattern descriptions. This use case is ideal for anyone looking to deepen their understanding of market dynamics.
Frequently Asked Questions
How does Chart Echo find matching historical patterns?
Chart Echo uses a proprietary fractal matching algorithm that analyzes the shape of your current chart pattern and searches across approximately 450 million historical windows. The algorithm compares the geometric structure of your pattern against historical data, ranking matches by their similarity strength. It does not use traditional technical indicators or oscillators; it focuses purely on the visual shape and structure of the price action. The system then retrieves the future price action for each match to compute outcome statistics.
Is Chart Echo a prediction tool or financial advice?
No, Chart Echo is explicitly not a prediction tool and does not provide financial advice. It is a research and analysis tool that organizes historical market data so you can study precedent. The platform shows you what happened in the past when similar chart patterns occurred, but past performance does not guarantee future results. All outcome statistics are presented as historical probabilities, not predictions. Users are encouraged to use the data as one input among many in their decision-making process.
What markets and timeframes are supported?
Chart Echo supports both stocks and cryptocurrencies, covering a broad range of popular tickers and assets. The platform allows you to set the timeframe and define how many candles constitute your pattern. Free accounts have access to standard timeframes, while premium accounts unlock intraday timeframes for more granular analysis. The historical database includes decades of data across all supported markets, ensuring comprehensive coverage for most trading and investing scenarios.
Do I need to create an account to use Chart Echo?
No, you can try Chart Echo for free without signing up or creating an account. The free tier allows you to search for historical matches and view basic outcome statistics. Creating an account unlocks the ability to save workspaces and revisit your analyses later. A premium subscription adds advanced features including Pro Mode, saved-setup reminders, intraday timeframes, real-time alerts for new fractals, and watermark-free exports for sharing charts and GIFs.
Similar to Chart Echo
SnapPChart
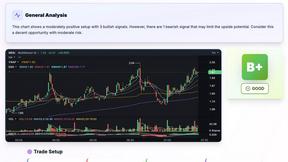
SnapPChart grades a trading chart screenshot A+ to F, with an entry, stop, targets, and risk/reward. Works on stocks, forex, crypto, futures.

Polymarket Trading Bot For Crypto
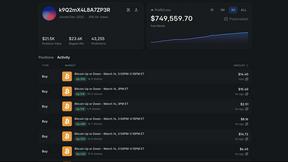
This Polymarket trading bot automates high-frequency arbitrage and directional trading on 5-15 minute crypto markets, replicating a proven profitable.